Understanding Abnormal Capnograph: A Comprehensive Guide to ETCO2 Interpretation
At a Glance
- Always start with the ETCO₂ value and trend.
- Rule out technical causes before clinical causes.
- High ETCO₂ usually reflects hypoventilation, rebreathing or increased CO₂ production.
- Low ETCO₂ often reflects hyperventilation, low cardiac output or airway problems.
- Trend interpretation is often more valuable than a single number.
The first question should always be: Is there any ETCO₂? Is it normal, high or low? Most importantly, what is the trend?
This is a Second post on capnography focusing on how to simply understand abnormal capnograph. This is more of theoretical post, coming up is a graphical post on how to make interpretation in cardiac arrest, mechanical ventilation, sedation and other scenarios.
We discussed the anatomy of normal capnograph in the previous post already.
Never forget:
Most frequent abnormal capnograms results from technical problems like improper calibration, loose connection, cracks in connector of circuits specially in side stream capnography. These need to be ruled out before hand in case of sudden changes in trend and no correlation clinically or in relation with blood gases.
It is always useful to start by asking: Is there any EtCO2? Is it normal or abnormal? and what is the trend? - John H. Eichhorn. University of Mississippi school of medicine/Medical centre, Jackson, Mississippi.
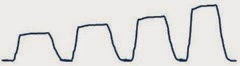
Checklist for Interpretation

- Phase I – Deadspace Gas
- Rebreathing? (1)
- Deadspace seem right?
- Phase II – Transitional Phase
- Transition from upper to lower airways Should be steep. (3)
- Represents changes in perfusion.
- Phase III – Alveolar Gas Exchange
- Changes in gas distribution.
- Increased slope = mal-distribution of gas delivery. (5)
- End of Phase III is the PETCO2. (6)
- Area under the curve represents the volume of expired CO2 (VCO2). (7)
- Total Exhaled volume (8)
Causes of Altered ETCO2
High EtCO2
- Decreased alveolar ventilation. eg. V/Q mismatch, decreased respiratory effort due to disease or sedation, decrease in tidal volume because of inappropriate ventilator settings or reduced compliance, partially obstructed airway due to secretion or kinks.
- Increased rebreathing of CO2. eg. Abnormally functioning exhalation valve, Inadequate inspiratory flow. Insufficient expiratory time, Malfunction of a CO2 absorber system (exhausted sodalime), Partial rebreathing circuits
- Increased CO2 production. eg. Fever, sepsis, malignant hyperthermia.
- Sodium bicarbonate infusion. Bicarbonate given for acidosis dissociates into CO2, if adequate arrangement for CO2 washout is not made, it may adversely can cause acidosis.
Low EtCO2
- Increased alveolar ventilation. eg. Increase in RR or TV, Hyperventilation from any cause, DKA,
- No gaseous exchange. eg. Apnoea, complete obstruction of upper airway.
- Mechanical causes eg. leak in circuit, broken sampling tube, dislodgement of ET tube.
- Decreased CO2 production. eg. Hypothermia, decrease muscular activity like use of muscle relaxant.
- Decreased pulmonary circulation. Less CO2 is brought to the lung for exchange so less is exhaled. eg. Low cardiac output states, Cardiac arrest, Pulmonary embolism, Inadequate chest compression while CPR.
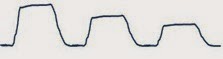
ETCO2 Trends and Clinical Significance
Exponential decrease in PETCO2 reflects a catastrophic event in the patient's cardiopulmonary system.
- Sudden Hypotension/massive blood loss
- Circulatory arrest with continued ventilation
- Pulmonary embolism
- Cardiopulmonary Bypass
Gradual decrease in PETCO2 indicates a decreasing CO2 production, or decreasing systemic or pulmonary perfusion.
- Hypothermia
- Sedation like thiopental coma (also might cause increasing trend by hypoventilating)
- Hyperventilation
- Hypovolemia
- Decreasing Cardiac Output.
Using a-ETCO2 Gradient
Read basics of gradient between arterial and PEtCO2 in previous post on capnography here. Decrease in cardiac output and pulmonary blood flow causes decrease in PETCO2 but the arterial PaCO2 remains same therefore the difference between them increases causing high a-EtCO2 gradient. Thus if ventilation kept same, this gradient can be used for monitoring pulmonary blood flow or indirectly the cardiac output (Details in following post on capnography for cardiac arrest)
Increased Alveolar Dead Space
- Low cardiac output
- Pulmonary embolism
- Other causes, Obstructive lung disease, Excessive lung inflation
This study in respiratory care in 2005 concluded presence of moderate to strong positive linear correlation between PETCO2 and PaCO2 difference for all ratios of dead space to tidal volume (VD/VT) ranges, although the strength of the correlation decreased slightly as VD/VT increased. As expected physiologically, the absolute difference between PETCO2 and PaCO2 consistently increased with increasing VD/VT.
ETCO2 and Metabolic Acidosis
EtCO2 tracks serum HCO3 & degree of acidosis (Decreasing EtCO2 = Increasing metabolic acidosis)
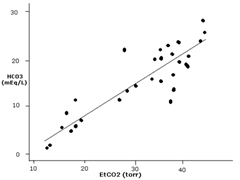
Thus helps to distinguish DKA from NKHHC and dehydration.
ETCO2 and Synypnea
ETCO2 can help in distinguishing those patient with actual hyperventilation with same respiratory rate. ETCO2 is much more accurate than the RR. The RR is just a measure of how many times someone is breathing. The ETCO2 is how they are ventilating.
There is lot more to make use of ETCO2 !
- During Apnea Testing in Brain-dead patients. (Eur J Anaesthesia Oct 2007, 24(10):868-75)
- Evaluating DKA in children. No patients with a PETCO2 >30 had DKA. (J Paeditr Child Health Oct 2007, 43(10):677-680)
- Vd/Vt ratio and ARDS Mortality. Elevated Vd/Vt early in the course of ARDS was correlated with increased mortality. (Chest Sep 2007, 132(3): 836-842)
- PCA Administration "Continuous respiratory monitoring is optimal for the safe administration of PCA, because any RD event can progress to respiratory arrest if undetected." (Anesth Analg Aug 2007, 105(2):412-8)
Never Forget
Most sudden capnography abnormalities are caused by technical issues such as loose connections, cracked connectors, sampling-line problems, calibration issues, or circuit leaks. Always correlate with the patient and blood gases.
Causes of High ETCO₂
- Hypoventilation
- Airway obstruction
- Reduced lung compliance
- Rebreathing due to faulty valves
- Exhausted soda lime
- Fever and sepsis
- Malignant hyperthermia
- Sodium bicarbonate administration
Causes of Low ETCO₂
- Hyperventilation
- DKA
- Apnea
- Complete airway obstruction
- Circuit leak
- ET tube dislodgement
- Hypothermia
- Low cardiac output
- Pulmonary embolism
- Cardiac arrest
Trends in Capnography
Trends are very important and gives a idea of changes in airway status, ventilation, and perfusion of lung as well as mechanical issues in critically ill children over a period of time.
It also can be utilized to audit the case in retrospect.
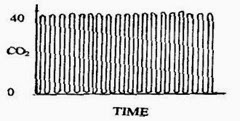
A time capnogram may be recorded at two speeds. A high speed capnogram (about 7mm/sec) gives detailed information about each breath whereas the overall CO2 changes (trend) can be followed at a slow (about 0.7 mm/sec) speed.
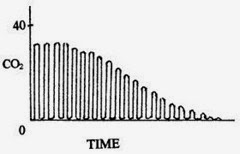
This image depicts the trend of capnography showing events that caused a decrease in end tidal CO2 as discussed above and possible causes including acute onset hypotension, circulatory collapse and pulmonary embolism can be suspected.
References
- www.capnography.com
- S David McSwain MD et al, End-Tidal and Arterial Carbon Dioxide Measurements Correlate Across All Levels of Physiologic Dead Space. Respiratory care, march 2010 VOL 55 NO 3.
- Madati PJ1, Bachur R. Development of an emergency department triage tool to predict acidosis among children with gastroenteritis. Pediatr Emerg Care. 2008 Dec;24(12):822-30.
- Fearon DM, Steele DW. End-tidal carbon dioxide predicts the presence and severity of acidosis in children with diabetes. Acad Emerg Med. 2002 Dec;9(12):1373-8. PubMed PMID: 12460840.
- D'MELLO, BUTANI. Indian J. Anaesth. 2002; 46 (4) : 269-278.
💡 Join the Discussion!
🩺 Help us refine this article — share corrections or additional information below. Let's elevate the accuracy of knowledge together! 💉💬